My House Talks Too Much: Taming 4,000 Appliance Notifications Into Actually Useful Alerts
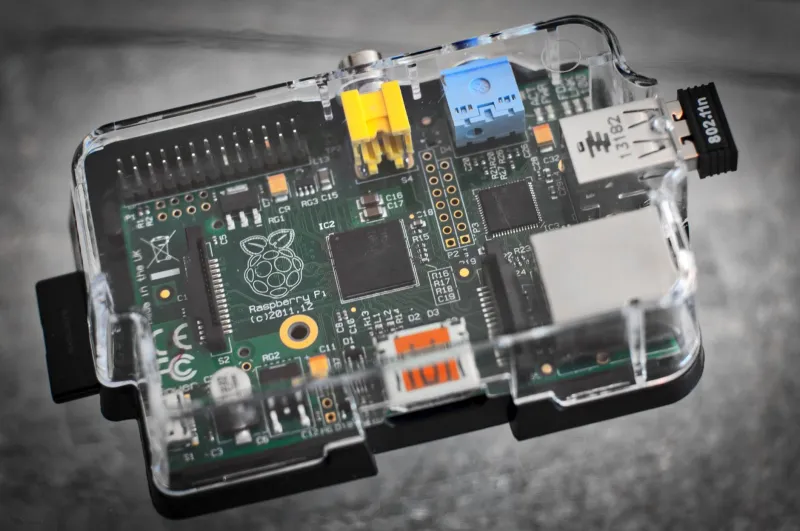
Every smart home evangelist tells you the same thing: instrument everything. Know your house. Data is power. So I did what any reasonable maker would do — I spent a weekend strapping current sensors, contact sensors, and temperature probes onto every major appliance I own, pointed all of it at a local MQTT broker, and built a dashboard on a Raspberry Pi sitting in my closet.
Then I opened the notification counter on day three and felt my stomach drop. Four thousand pings. From my own kitchen.
What a Normal House Actually Says
Here's the thing nobody mentions when they're showing off their Grafana dashboards: a house is chatty. Not in a dramatic, alarm-bell way — in a nervous, hummingbird way. My refrigerator alone reported compressor state changes every few minutes. The washing machine cycled through a dozen sensor states per load. The sump pump, the water heater, the chest freezer in the garage — each one a tiny radio station broadcasting the same song on repeat.
Over 30 days, I logged roughly 38,000 raw sensor events. The breakdown was humbling:
- Door open/close events: ~9,200 (thanks, teenagers)
- Temperature and humidity readings: ~14,000
- Power draw state changes: ~8,500
- "Everything is fine" heartbeat messages: the rest
Read that last category again. The overwhelming majority of my home's chatter was it telling me, over and over, that nothing was wrong. That's not insight. That's a smoke detector with anxiety.
The Dashboard Lied to Me (Kind Of)
My dashboard looked incredible. Sparking line graphs, color-coded appliance tiles, a live feed scrolling like a stock ticker. It was also, functionally, useless — because I couldn't distinguish signal from noise when everything screamed at the same volume.
The wake-up call came when my chest freezer's door sensor failed open. Buried in the flood of routine events was the one notification that mattered: a compressor running 40% longer than its normal duty cycle. I found it three days later, manually scrolling. The freezer was fine, but the point wasn't. My system had the data. It just didn't know how to interrupt me.
Three Filters That Changed Everything
1. Aggregate Before You Alert
Raw events are for databases, not humans. I stopped alerting on individual readings and started alerting on aggregates. Instead of "fridge door opened," it became "fridge door open more than 4 minutes." Instead of "sump pump cycled," it became "sump pump cycled more than 6 times per hour." Same data, radically different usefulness. A single reading tells you a state; a rolling window tells you a trend, and trends are what actually require a human.
2. Build Thresholds With Hysteresis
My first attempt at alerting used hard cutoffs: alert if the garage drops below 40°F. Classic mistake. The temperature hovered at 39.9°F for an hour and I got pinged into oblivion as readings bounced across the line.
The fix is hysteresis — two thresholds instead of one. Alert when the temp drops below 38°F, but don't clear the alert until it climbs back above 42°F. That dead band stops the flapping. It's a five-line change in Node-RED and it cut my false alerts by something like 80% overnight.
3. Earn Every Notification
I adopted a brutal rule: if a notification arrives and my reaction is "okay, whatever," that alert gets demoted or deleted. Notifications are a debit against my attention, and my attention is finite. After a month of pruning, my daily alert count went from 130+ down to about 6 — and every single one of those 6 is something I'd genuinely want to know. The freezer door. The water heater leak sensor. The sump pump that didn't cycle when it should have.
The Quiet Dashboard Is the Good One
There's a philosophical shift here that took me weeks to internalize. A good home telemetry system isn't the one that tells you the most. It's the one that stays silent until it has something worth saying — like a good smoke detector, or a good spouse.
Everything else belongs in a dashboard you check on purpose, over coffee, maybe once a day. My Grafana instance still holds all 38,000 events. I can slice power usage by appliance, spot the dying freezer before it dies, and settle disputes about who left the garage fridge open. The data's all there. It's just stopped shouting.
If you're starting your own full-telemetry experiment, my advice is inverted from what you'd expect: build the dashboard first, live with it silently for two weeks, and only then decide what's worth a ping. Your future self — the one not reaching for a silenced phone — will thank you.
The hardware, by the way, cost me under $90 total: a handful of ESP32s, some SCT-013 current clamps, door contacts from the clearance bin, and that trusty closet Raspberry Pi running Mosquitto. The expensive part was never the gear. It was learning when to shut up and listen.